Major Systems Current Condition
Click here to view interactive charts for each reservoir and total system storage
Reservoir Data Dashboard
Click here to learn more about basin water use
State Usage
upper_basin_geo  = FileAttachment("GIS_Data/UpperBasin_HUC2.geojson").json()
lower_basin_geo  = FileAttachment("GIS_Data/LowerBasin_HUC2.geojson").json()
reservoirs_geo   = FileAttachment("GIS_Data/Reservoirs.geojson").json()
rivers           = FileAttachment("GIS_Data/Colorado_River_Basin_Rivers.geojson").json()
{
const div = html`<div style="width:100%; height:700px;"></div>`
// Allow div to render before initializing map
yield div
const map = L.map(div, {
center: [36.5, -112],
zoom: 6
})
// Basemap tile layer
const tiles = L.tileLayer("https://{s}.tile.openstreetmap.org/{z}/{x}/{y}.png", {
attribution: "© OpenStreetMap contributors",
maxZoom: 18
}).addTo(map)
// Upper Basin polygon layer
const upper_basin_layer = L.geoJSON(upper_basin_geo, {
style: {
color: "#1a6496",
weight: 2,
fillColor: "#5bc0de",
fillOpacity: 0.3
}
}).addTo(map)
// Lower Basin polygon layer
const lower_basin_layer = L.geoJSON(lower_basin_geo, {
style: {
color: "#a94442",
weight: 2,
fillColor: "#e06666",
fillOpacity: 0.3
}
}).addTo(map)
// Rivers
const rivers_layer = L.geoJSON(rivers, {
style: {
color: "#006cfa",
weight: 2
}
}).addTo(map)
// Reservoir point layer
const reservoirs_layer = L.geoJSON(reservoirs_geo, {
// Custom marker style
pointToLayer: (feature, latlng) => {
// Color scaling
const color_scale = pct => {
if (pct >= 70) return "#198754" // green - above 70%
else if (pct >= 50) return "#ffc107" // yellow - 50-70%
else if (pct >= 30) return "#fd7e14" // orange - 30-50%
else return "#dc3545" // red - below 30%
}
const pct_full = feature.properties.Percent_Full_MAF ?? 0
const capacity = feature.properties.Max_Capacity_MAF ?? 0
const radius = Math.sqrt(capacity) * 5
return L.circleMarker(latlng, {
radius: radius,
fillColor: color_scale(pct_full),
color: "white",
weight: 2,
fillOpacity: 0.9
})
},
onEachFeature: (feature, layer) => {
const p = feature.properties
const popup_html = `
<div style="width: 380px; font-family: sans-serif;">
<b style="font-size: 14px;">${p.Reservoir}: ${p.Date}</b>
<hr style="margin: 6px 0; border-color: #dee2e6;">
<div style="display: flex; gap: 16px;">
<!-- Elevation column -->
<div style="flex: 1;">
<div style="font-size: 11px; font-weight: 700; color: steelblue;
text-transform: uppercase; margin-bottom: 6px;">
Elevation
</div>
<table style="width: 100%; font-size: 12px; border-collapse: collapse;">
<tr style="border-bottom: 1px solid #dee2e6;">
<td style="padding: 4px 0; color: #6c757d;">Current</td>
<td style="padding: 4px 0; text-align: right; font-weight: 600;">${p.Elevation ?? "N/A"} ft</td>
</tr>
<tr style="border-bottom: 1px solid #dee2e6;">
<td style="padding: 4px 0; color: #6c757d;">1yr Ago</td>
<td style="padding: 4px 0; text-align: right; font-weight: 600;">${p.Elv_1yr_Ago ?? "N/A"} ft</td>
</tr>
<tr style="border-bottom: 1px solid #dee2e6;">
<td style="padding: 4px 0; color: #6c757d;">10yr Avg</td>
<td style="padding: 4px 0; text-align: right; font-weight: 600;">${p.Elv_Day_Avg_10yr ?? "N/A"} ft</td>
</tr>
<tr>
<td style="padding: 4px 0; color: #6c757d;">30yr Avg</td>
<td style="padding: 4px 0; text-align: right; font-weight: 600;">${p.Elv_Day_Avg_30yr ?? "N/A"} ft</td>
</tr>
</table>
</div>
<!-- Divider -->
<div style="width: 1px; background: #dee2e6;"></div>
<!-- Storage column -->
<div style="flex: 1;">
<div style="font-size: 11px; font-weight: 700; color: steelblue;
text-transform: uppercase; margin-bottom: 6px;">
Storage
</div>
<table style="width: 100%; font-size: 12px; border-collapse: collapse;">
<tr style="border-bottom: 1px solid #dee2e6;">
<td style="padding: 4px 0; color: #6c757d;">Current</td>
<td style="padding: 4px 0; text-align: right; font-weight: 600;">${p.Storage_MAF ?? "N/A"} MAF | ${p.Percent_Full_MAF}%</td>
</tr>
<tr style="border-bottom: 1px solid #dee2e6;">
<td style="padding: 4px 0; color: #6c757d;">1yr Ago</td>
<td style="padding: 4px 0; text-align: right; font-weight: 600;">${p.StorMAF_1yr_Ago ?? "N/A"} MAF</td>
</tr>
<tr style="border-bottom: 1px solid #dee2e6;">
<td style="padding: 4px 0; color: #6c757d;">10yr Avg</td>
<td style="padding: 4px 0; text-align: right; font-weight: 600;">${p.Stor_Day_Avg_10yr ?? "N/A"} MAF</td>
</tr>
<tr>
<td style="padding: 4px 0; color: #6c757d;">30yr Avg</td>
<td style="padding: 4px 0; text-align: right; font-weight: 600;">${p.Stor_Day_Avg_30yr ?? "N/A"} MAF</td>
</tr>
</table>
</div>
</div>
</div>
`
layer.bindPopup(popup_html, { maxWidth: 400 })
}
}).addTo(map)
// Layer control
L.control.layers(
{
// Base layers - only one can be active at a time
"OpenStreetMap": tiles
},
{
// Overlay layers - each has its own checkbox
"Upper Basin": upper_basin_layer,
"Lower Basin": lower_basin_layer,
"Reservoirs": reservoirs_layer,
"Rivers": rivers_layer
},
{
position: "topright", // position on map
collapsed: true // true = collapses to icon, false = always open
}
).addTo(map)
// Custom legend control
const legend = L.control({ position: "bottomleft" })
legend.onAdd = () => {
const legend_div = L.DomUtil.create("div")
legend_div.style.cssText = `
background: white;
padding: 10px 14px;
border-radius: 6px;
border: 1px solid #dee2e6;
font-size: 12px;
font-family: sans-serif;
box-shadow: 0 2px 6px rgba(0,0,0,0.15);
`
legend_div.innerHTML = `
<b style="font-size: 13px;">% of Capacity</b>
<div style="margin-top: 8px; display: flex; flex-direction: column; gap: 4px;">
<div style="display:flex; align-items:center; gap:8px;">
<div style="width:14px; height:14px; background:#198754; border-radius:50%;"></div>
<span>Above 70%</span>
</div>
<div style="display:flex; align-items:center; gap:8px;">
<div style="width:14px; height:14px; background:#ffc107; border-radius:50%;"></div>
<span>50% - 70%</span>
</div>
<div style="display:flex; align-items:center; gap:8px;">
<div style="width:14px; height:14px; background:#fd7e14; border-radius:50%;"></div>
<span>30% - 50%</span>
</div>
<div style="display:flex; align-items:center; gap:8px;">
<div style="width:14px; height:14px; background:#dc3545; border-radius:50%;"></div>
<span>Below 30%</span>
</div>
</div>
`
return legend_div
}
legend.addTo(map)
// Force Leaflet to recalculate map size after render
setTimeout(() => map.invalidateSize(), 100)
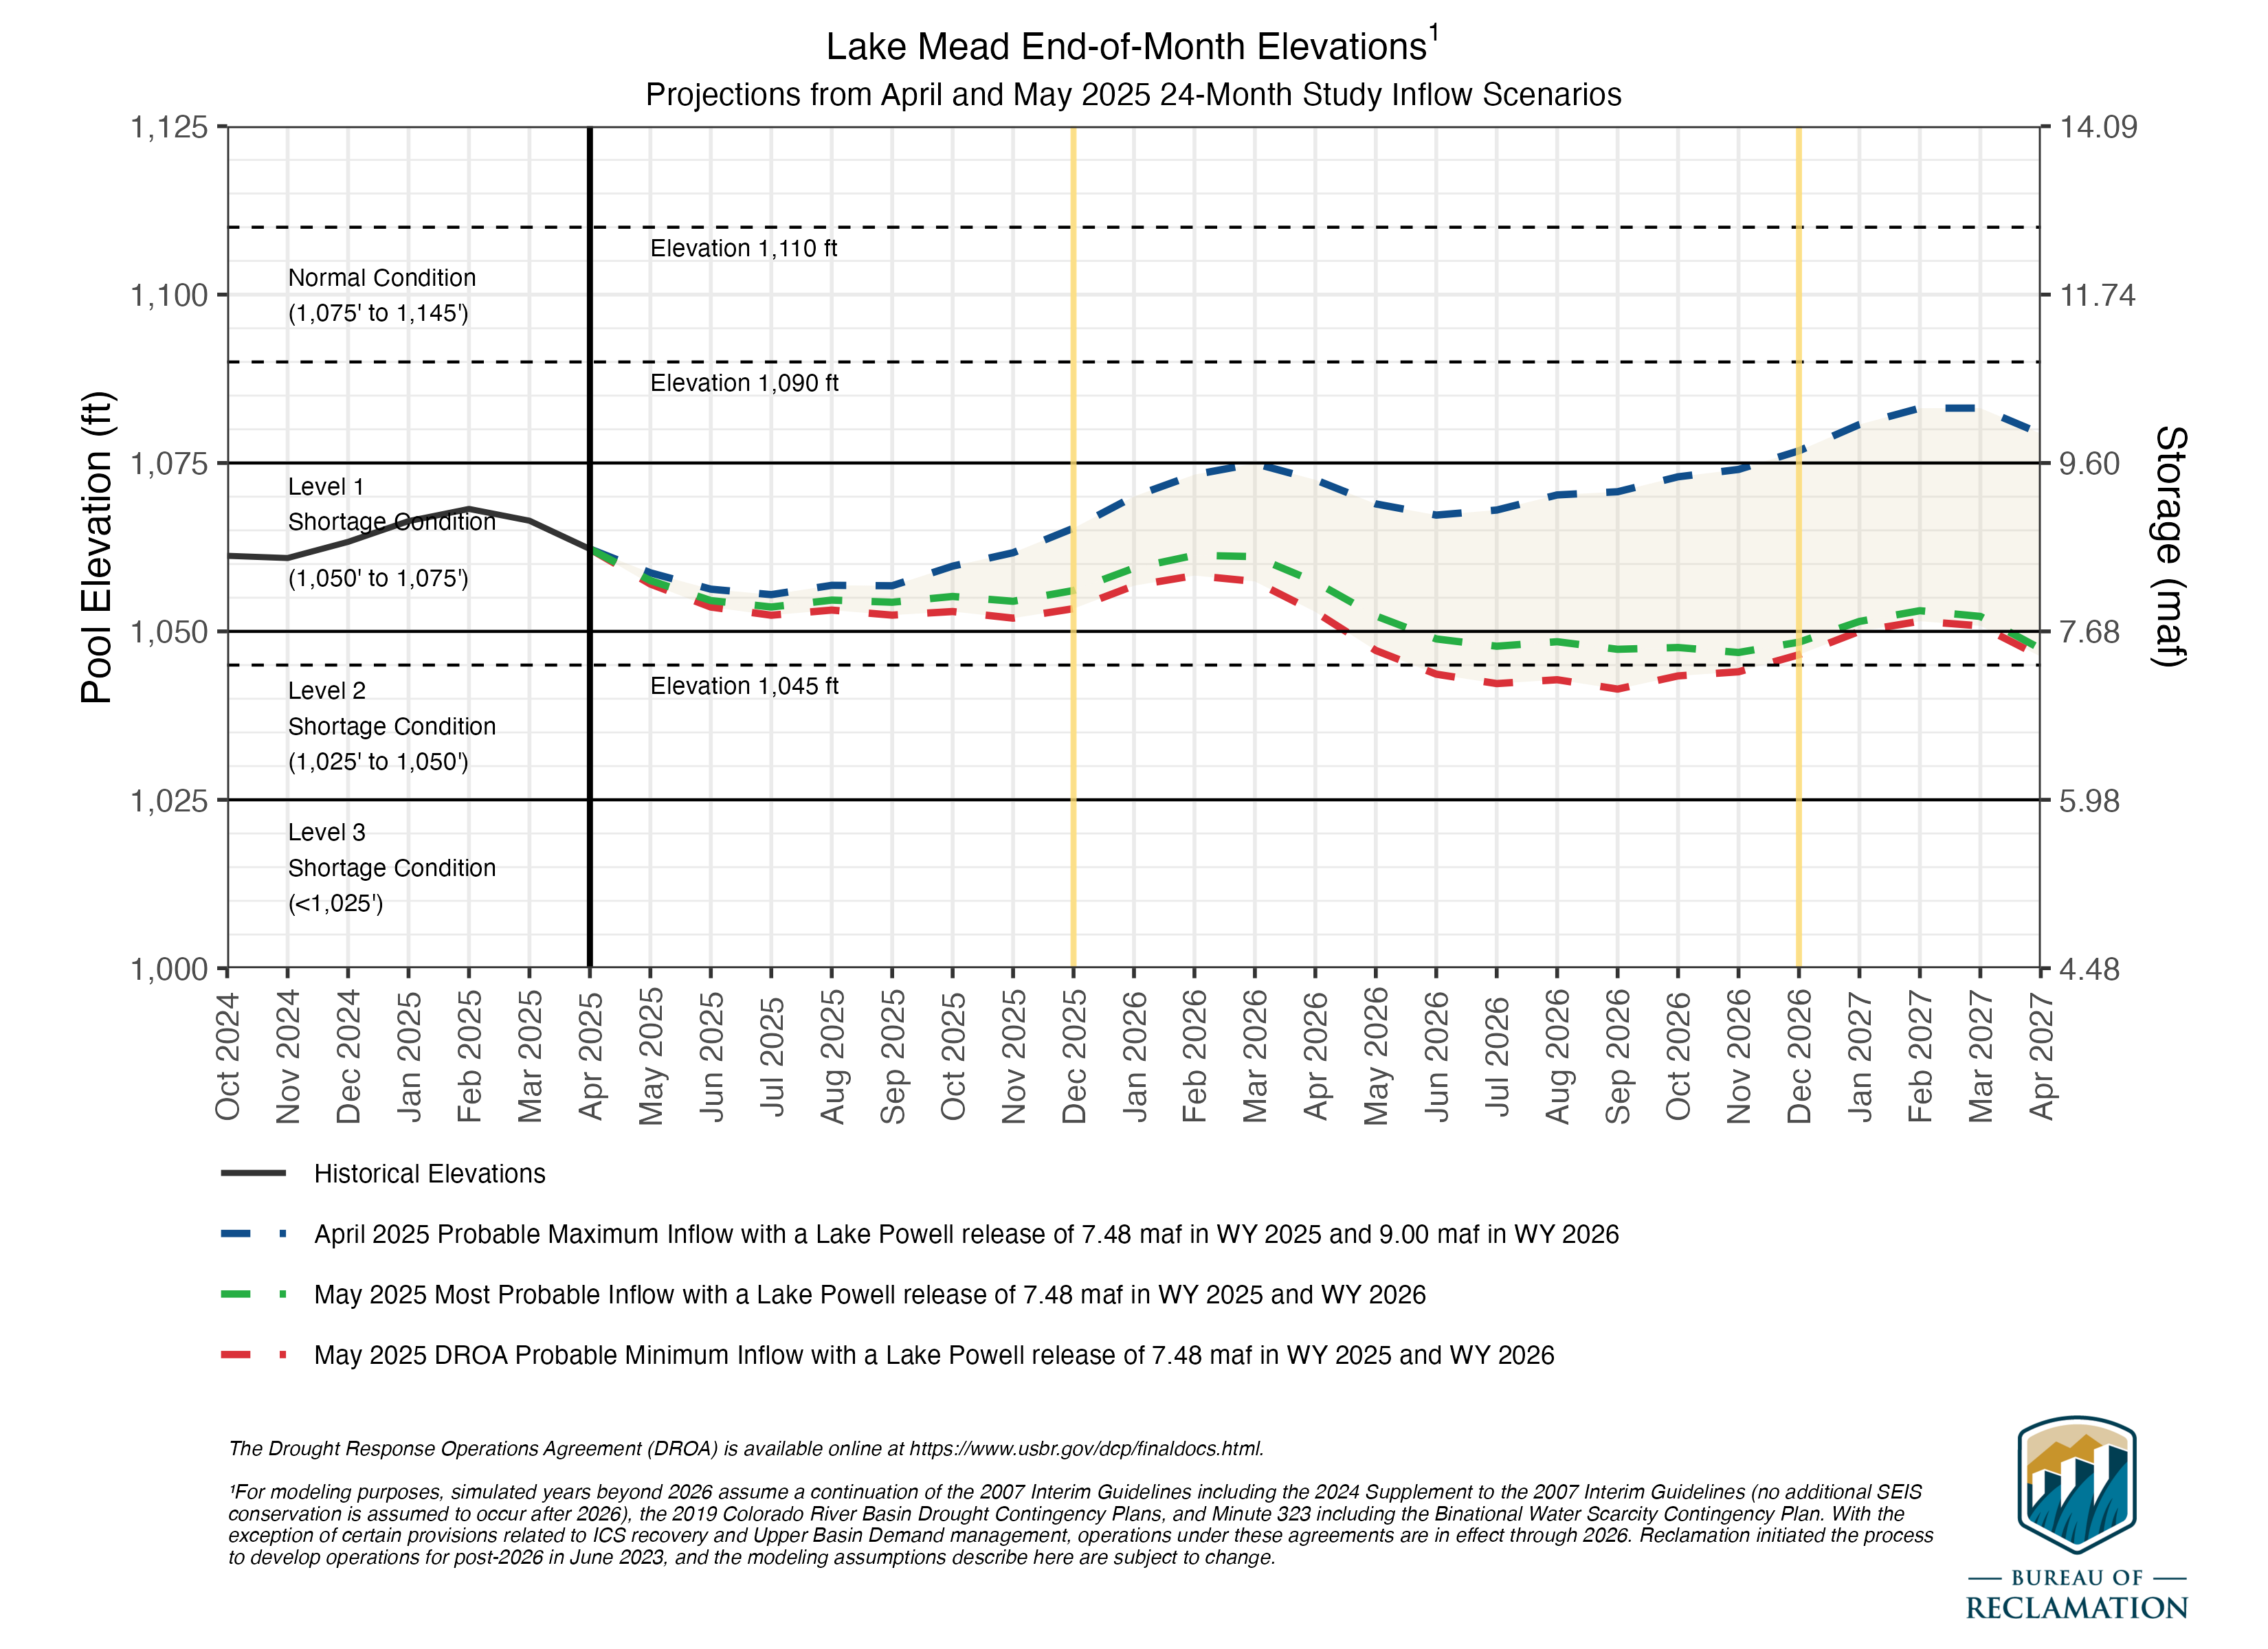
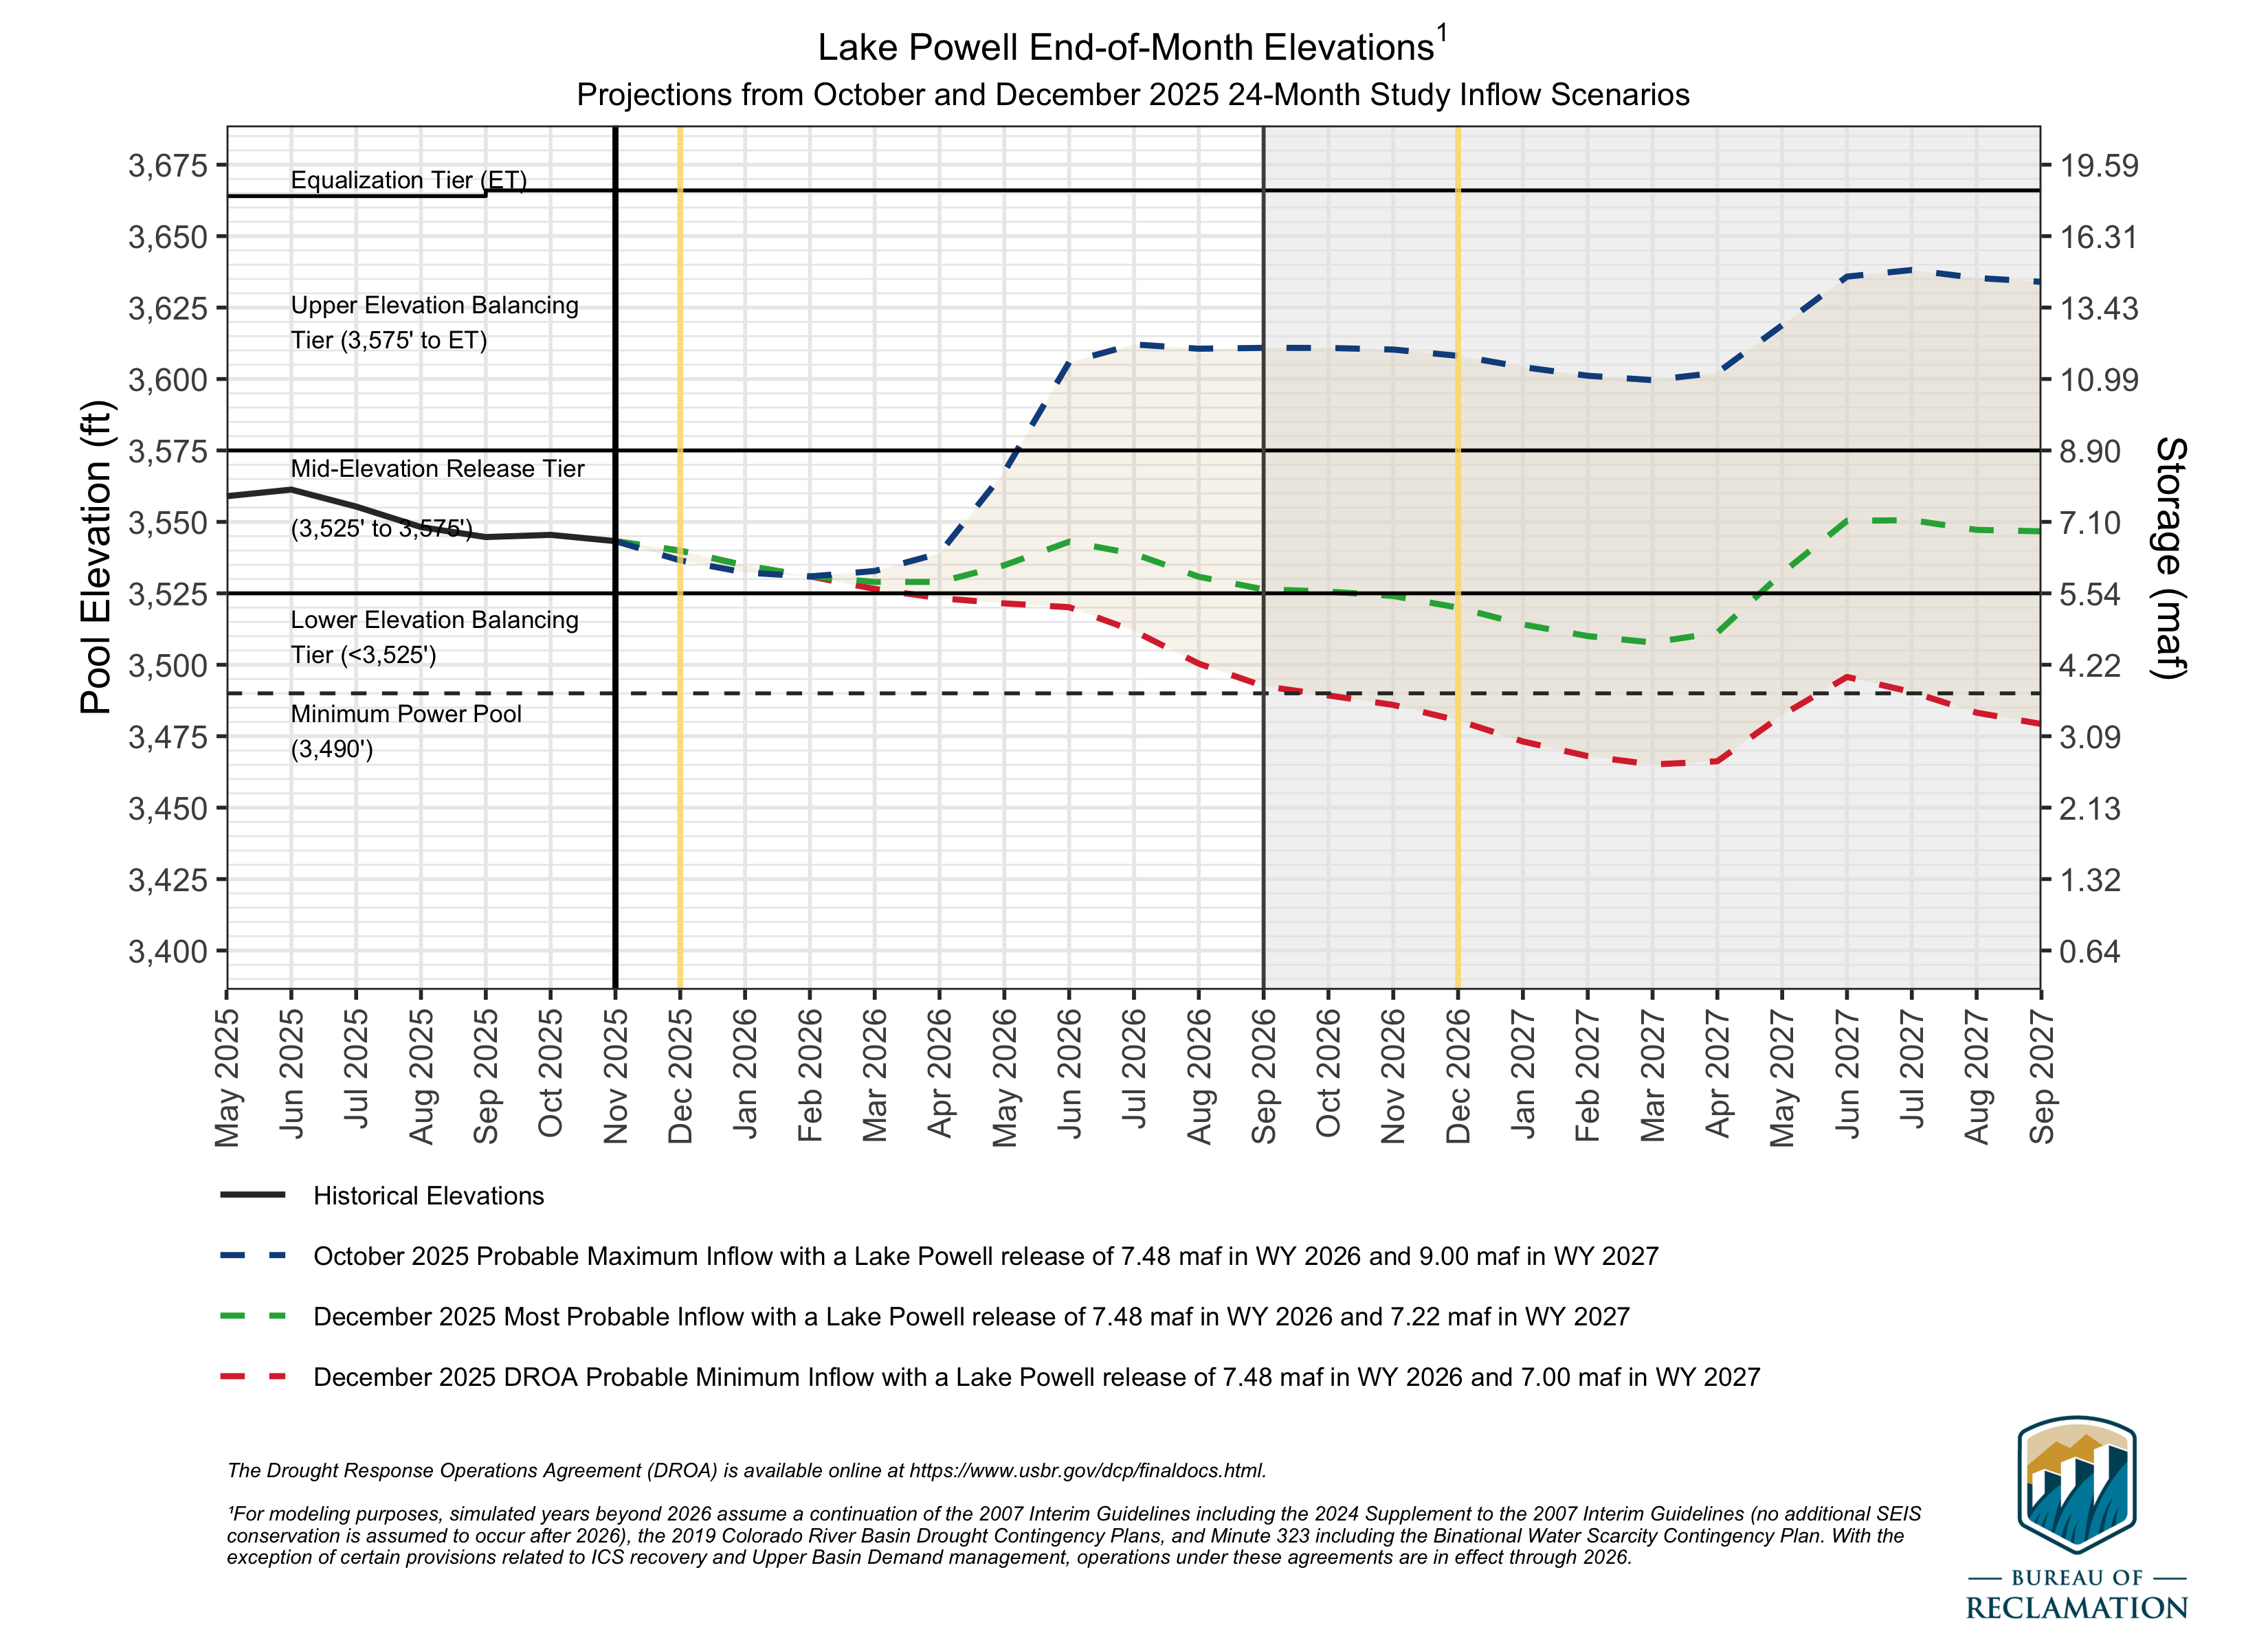
}USBR Projections
Lake Powell
Lake Mead